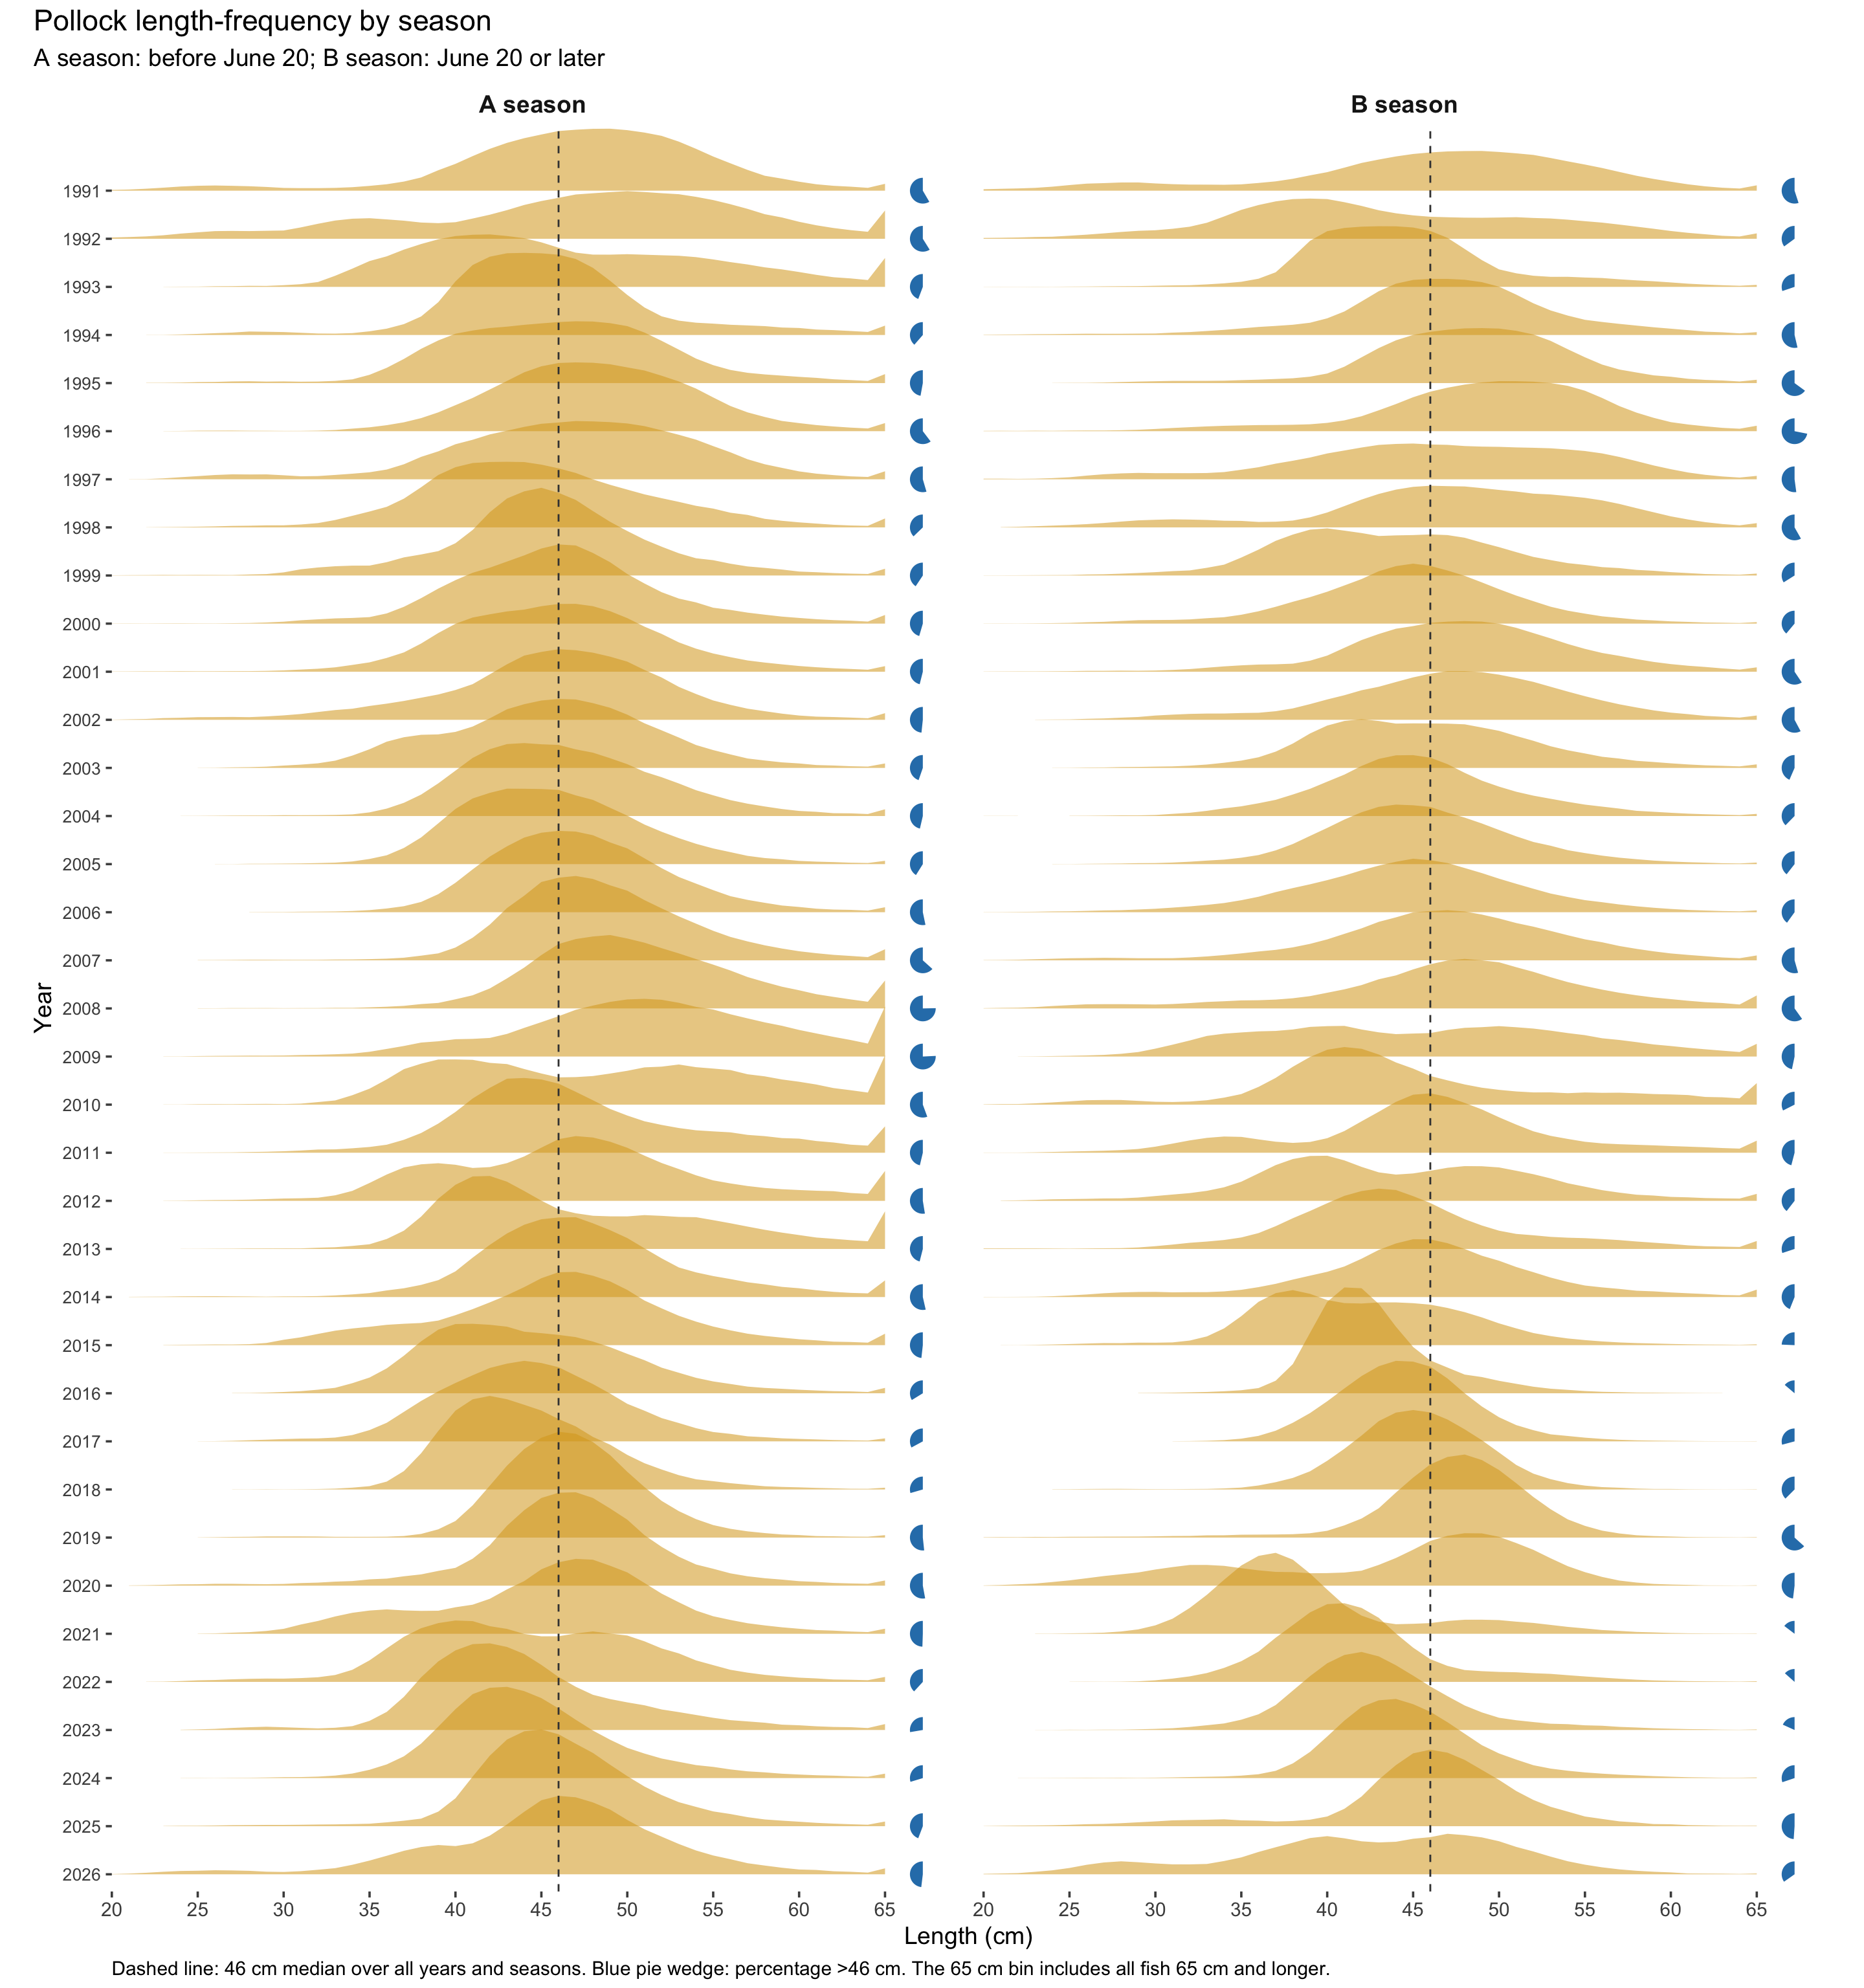
Pollock Length-Frequency by Season
A season before June 20; B season June 20 and later
This is an exploratory analysis of seasonal and spatial patterns in the observed pollock length-frequency samples. It is intended to identify patterns that may warrant further investigation, not to serve as a formal test of an assessment-model configuration.
Explore sex-ratio and growth patterns
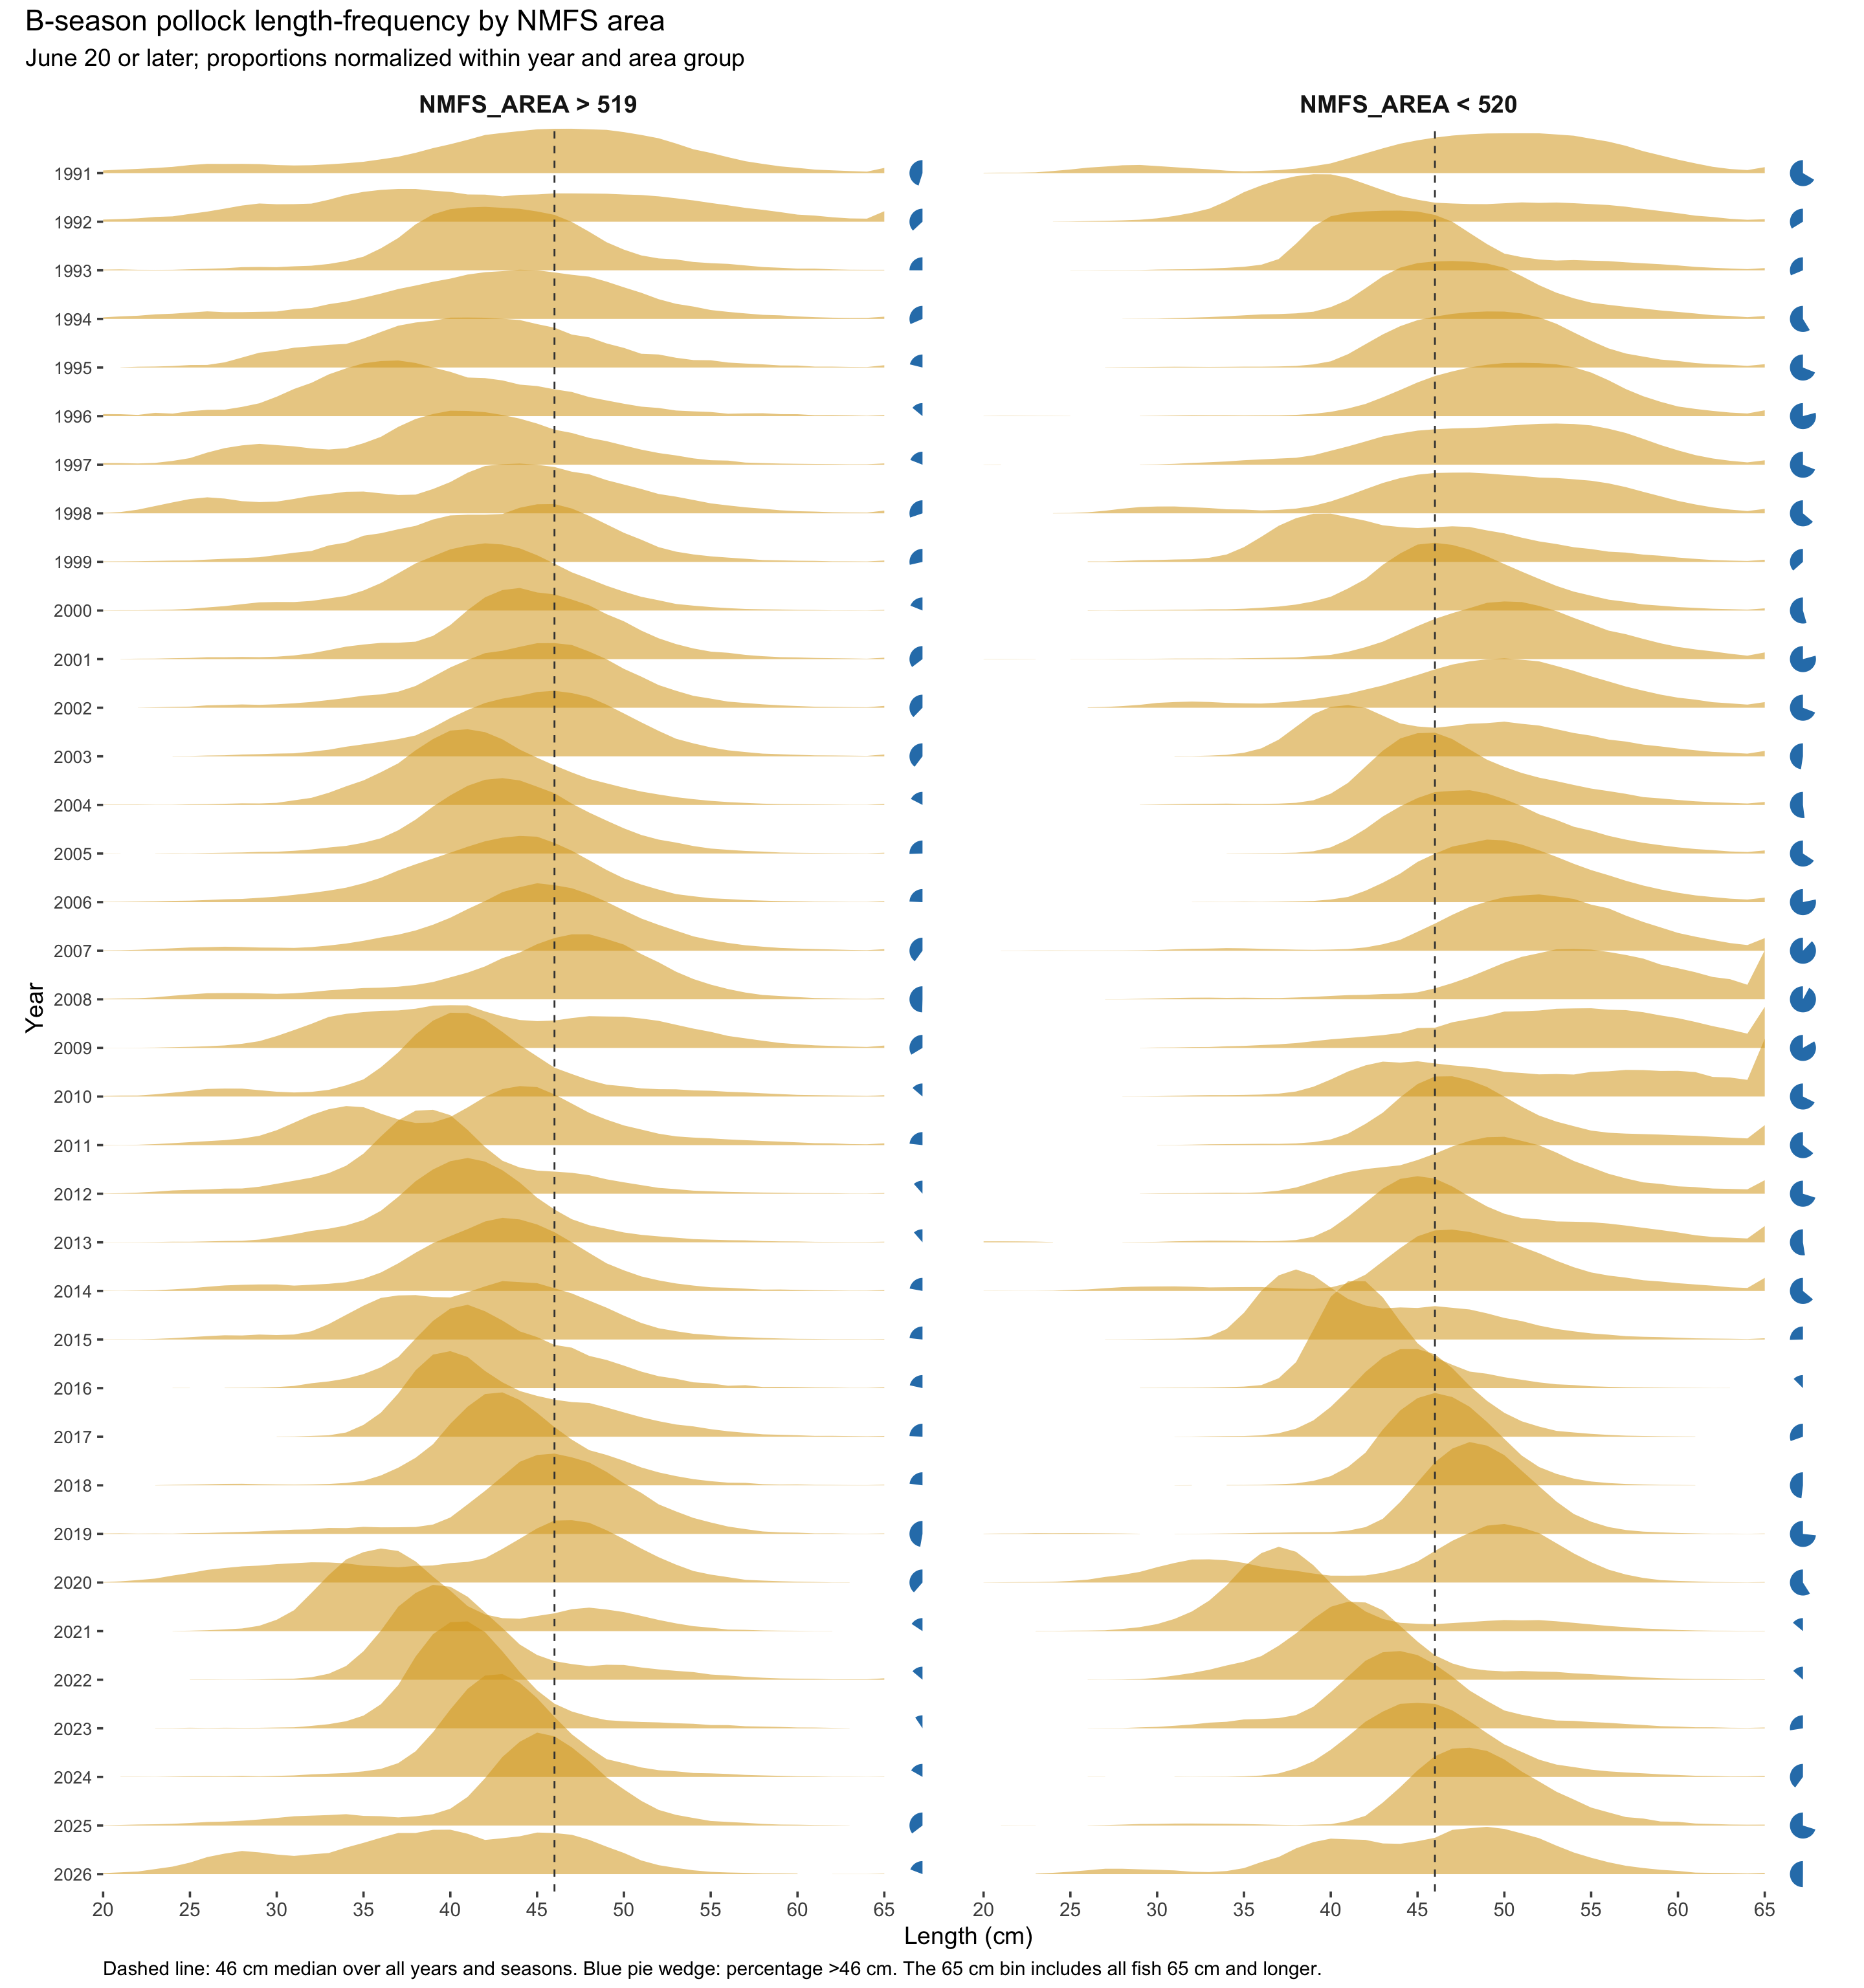
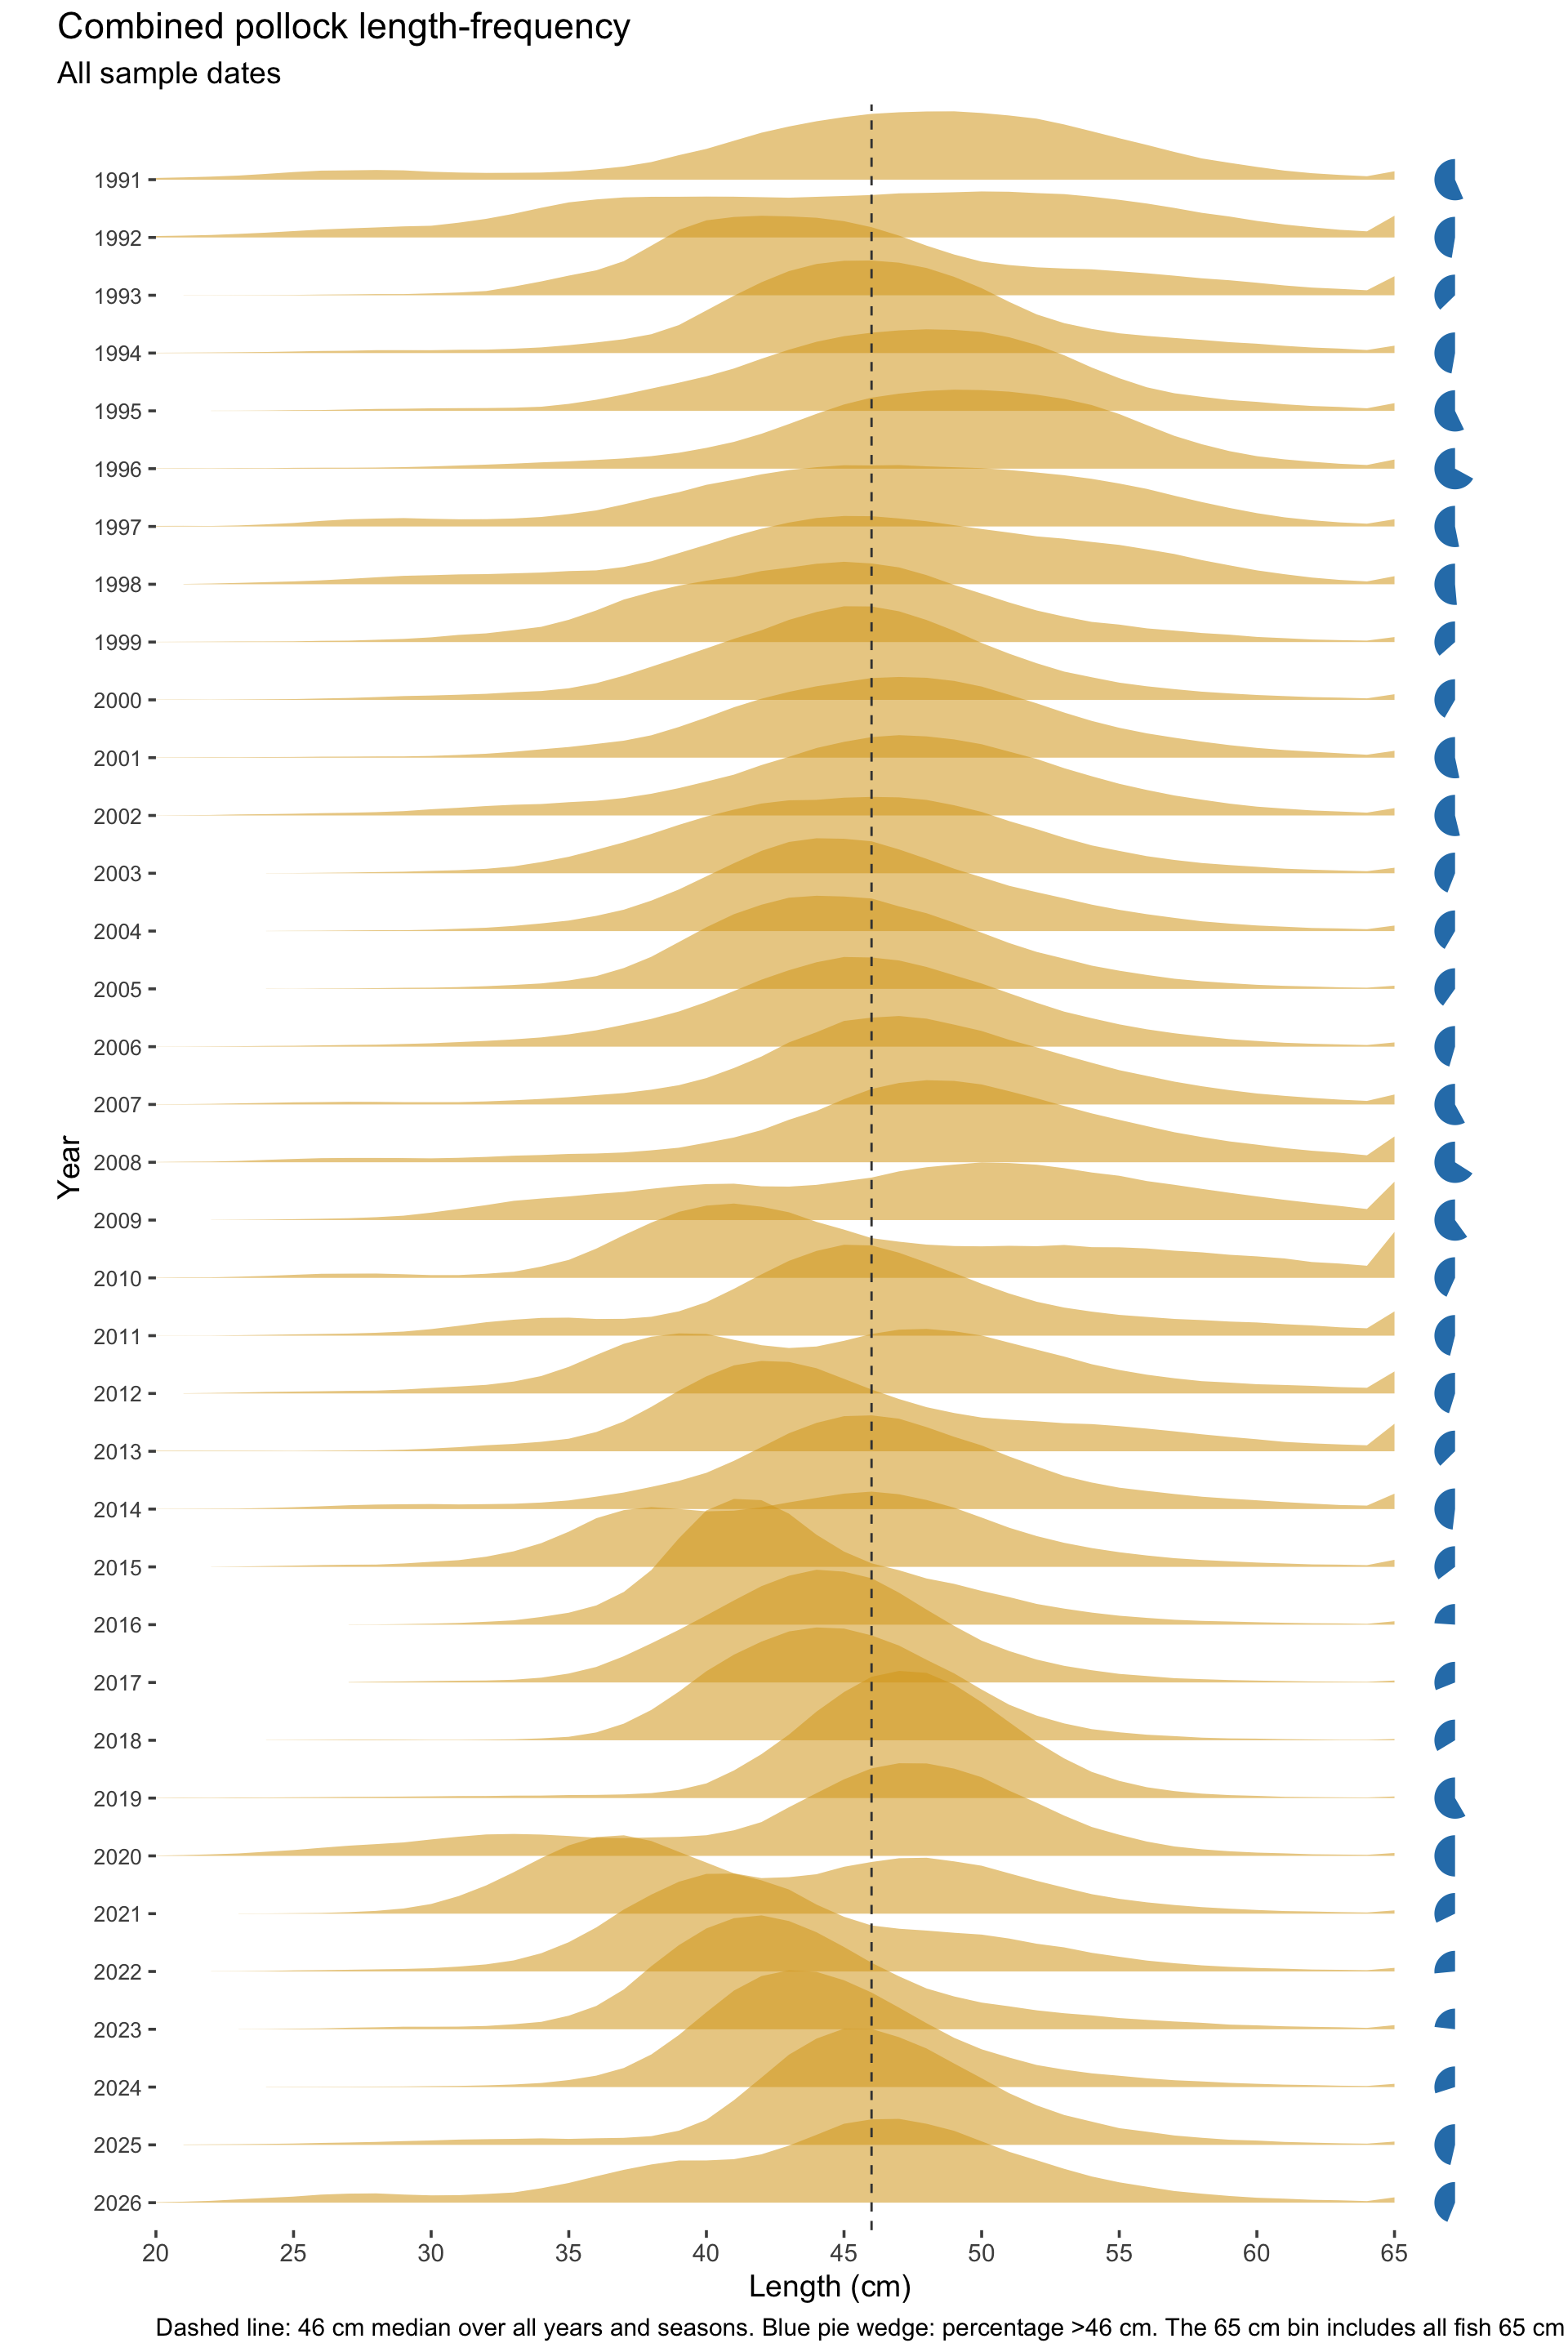
The figures show pollock (SPECIES = 201) observations as proportions within each year. A season includes samples before June 20; B season begins June 20. Only 1991 and later are included, and observations below 20 cm are excluded. Fish 65 cm and longer are accumulated in the 65 cm plus group. Each ridge is normalized over the displayed bins. Earlier years are shown at the top.
A and B seasons
Combined seasons
B season by NMFS area